
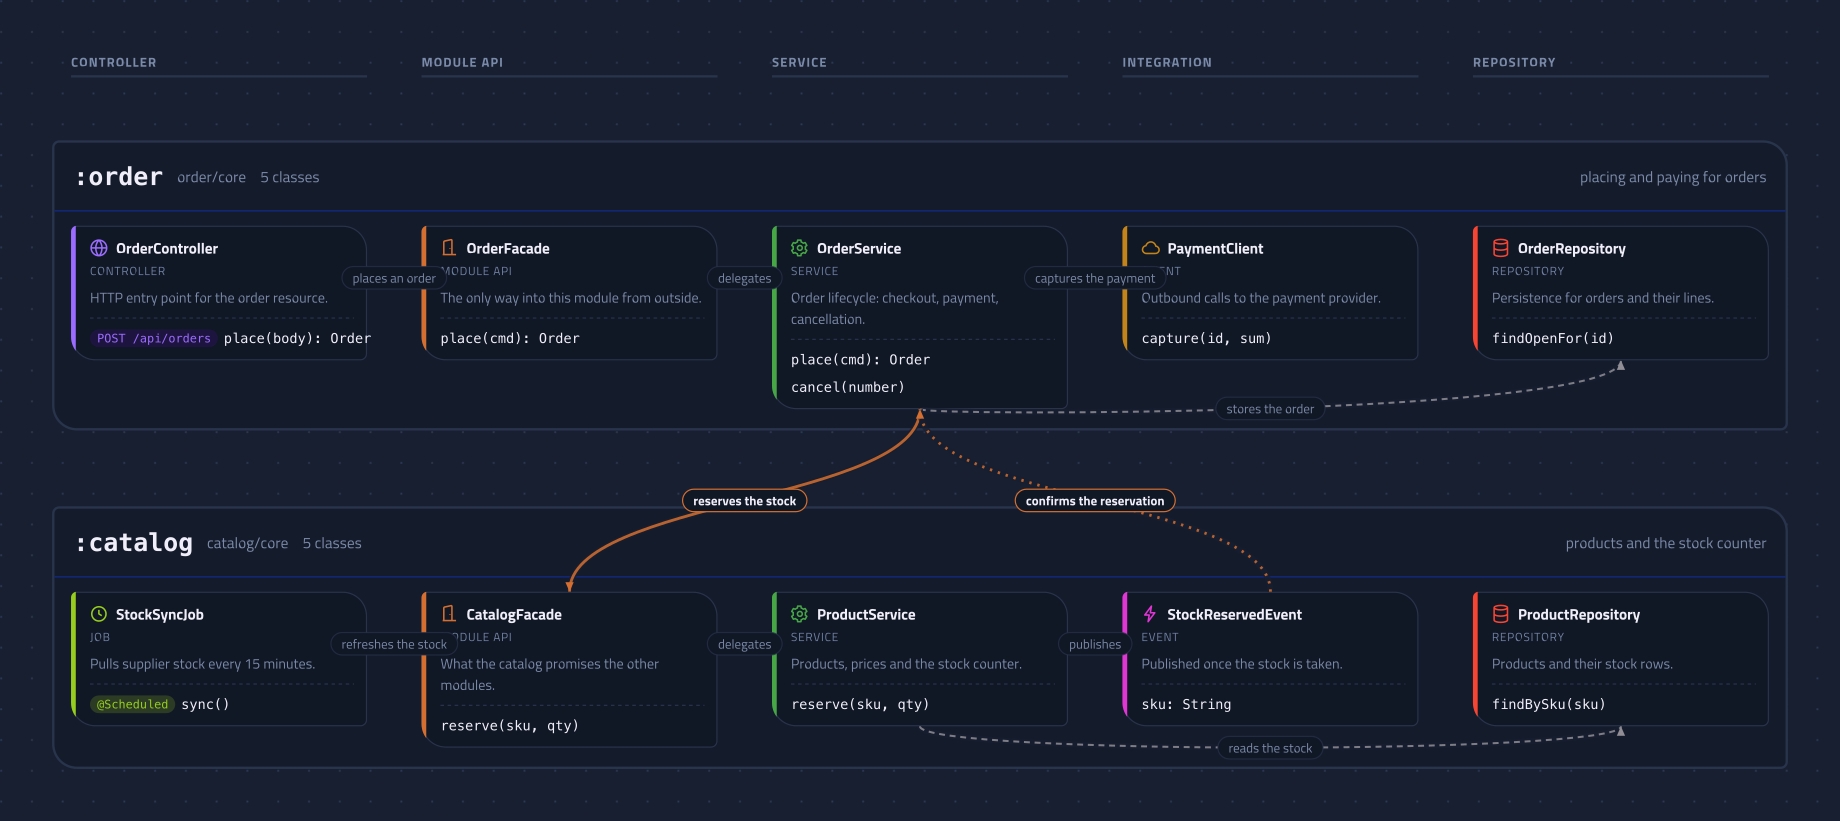
Every codebase has a map in it. The problem is that it only lives in the heads of the people who have been there since the start, and it gets a little worse with every sprint. TopoMap pulls that map out of the repo itself. The name is what it sounds like: topography plus map, the terrain your code sits on.
AI finally got good at the boring part
I am still sceptical about letting AI write the code that matters. But there is a whole category of work where elegance is irrelevant: reading a repo, pulling facts out of it and writing them down in a structured way. Claude Code is genuinely good at that now. It greps, opens files, follows a constructor injection and takes notes while doing it. Nobody enjoys that job, which is why nobody does it consistently.
TopoMap is three of those boring jobs stacked: analysis, data collection and then turning the result into something you can look at. The agent does the first two, your browser does the third.
The skills
There are two of them, /mw-topomap-springboot and /mw-topomap-angular. The
Spring Boot one does not care whether you are on Gradle or Maven, Kotlin or
Java, one module or twenty. The Angular one takes a plain app, a classic
multi-project workspace or an Nx monorepo.
The job is the same either way. Find the build modules or Nx projects, decide which classes earn a box (controller, service, repository, entity on one side, route, page, organism, state service on the other), pull out the public members and write a one-line purpose for each, then follow the calls between them. Finally the good part: every entry point becomes a use case, a path through the system you can click.
On the way through the code the agent also collects findings, the things it noticed without being asked. Coupling that runs the wrong way, a module without a proper API class, a service that quietly grew to 900 lines, a transaction boundary in an odd place. Every finding has to name a class, a count or a file. Otherwise it is the kind of advice that would have been true without ever opening the repo.
It also asks one thing up front: which language the descriptions should be in. Class summaries, method docs, edge labels and use case notes all follow that choice, while class and column names stay exactly as the code has them.
That is a lot of writing, and writing is where the tokens go. So the skill works in four stages and stops after each one to ask whether to carry on:
- modules and classes
- what each class offers - members, signatures, entity columns, first findings
- the connections between them, with labels
- the use cases
Stages 2 and 4 are roughly 80% of the whole thing. If you only want the shape of
your system, you stop after stage 1 and paid almost nothing for it. Each stage
lands as its own model-1.json to model-4.json, finished and openable on its
own, so stopping early wastes nothing.
The viewer
A JSON file is not a diagram, so
topomap.m1well.com is the other half: drop a
model.json anywhere on the page and it gets drawn.
I could have let the agent spit out HTML, but then the picture would be as dead as every architecture diagram that ever rotted in a wiki. The JavaScript is what makes it worth opening. Quickest way to see that: hit “load springboot example” on the start screen. That is one Spring Boot shop backend, 44 classes across 6 modules, opened in all four stages at once so you can watch what each stage adds.
Once a map is up, the toolbar on the left lets you hide whole modules or single stereotypes until only the part you care about is left, and a column with nothing left in it drops out so the rest closes the gap. “Show use cases” picks one path and lights it up across the modules with the steps numbered. “Show findings” brings up the list from earlier, and a click on one of them highlights the classes it is about. Click any class or component and a drawer slides in from the right with its members, who calls it, what it calls and which use cases it takes part in. The map takes the keyboard too: arrows pan, plus and minus zoom, 0 fits it back into the screen, and Escape unwinds what you opened one step per press - the list, then the highlight, then the drawer.
Up to five models can be open at once, each in its own tab with its own zoom, filters and selection. So you can put stage 1 and stage 4 of the same project next to each other, or two different services. The search field in the header dims everything that does not match and says how many classes are left, and it looks through class names, members, routes and docs as well as the module and the stereotype. And if the agent got a label wrong or missed an edge, the model is plain JSON: fix the line and drop the file in again.
And the part I care about most: nothing leaves your browser. No upload, no
endpoint, no storage. The model is read with FileReader and rendered locally.
A model.json describes your architecture, which for most of us is the last
file you want to paste into some random web tool. Open the network tab and check
for yourself, that is exactly why it is built this way.
80% is plenty
Be clear about what this is: the model is written by an AI reading your repo, an interpretation of the source and not a compiler pass. Long call chains, dynamic wiring and the rare exotic use case are where a detail goes missing, and it will go missing.
I stopped treating that as a problem. A map that is 80% right is still 80% more than you had before, and you can click through it instead of squinting at a whiteboard photo from 2023. Same with the findings: if 3 out of 15 are worth acting on, that is 3 more than the diagram nobody ever drew gave you.
The skills are on GitHub, the viewer lives at topomap.m1well.com. Drop a model on it and have a look at your own architecture.